
War Rhetoric vs Market Reaction: Here’s what everyone’s talking about today
Investors woke up today with Iran’s threat on the Strait of Hormuz dominating the headlines and it should matter.
Roughly 20% of global oil consumption flows through the Strait of Hormuz.¹ That’s not a theoretical risk but that is structural global infrastructure.
But here’s the twist: The markets are not behaving as if a real supply shock is already priced in.
That mismatch of high geopolitical risk + calm risk pricing is the story most commentators are missing right now.
Let’s unpack what’s actually happening on price charts and why traders in the UK and India should care.
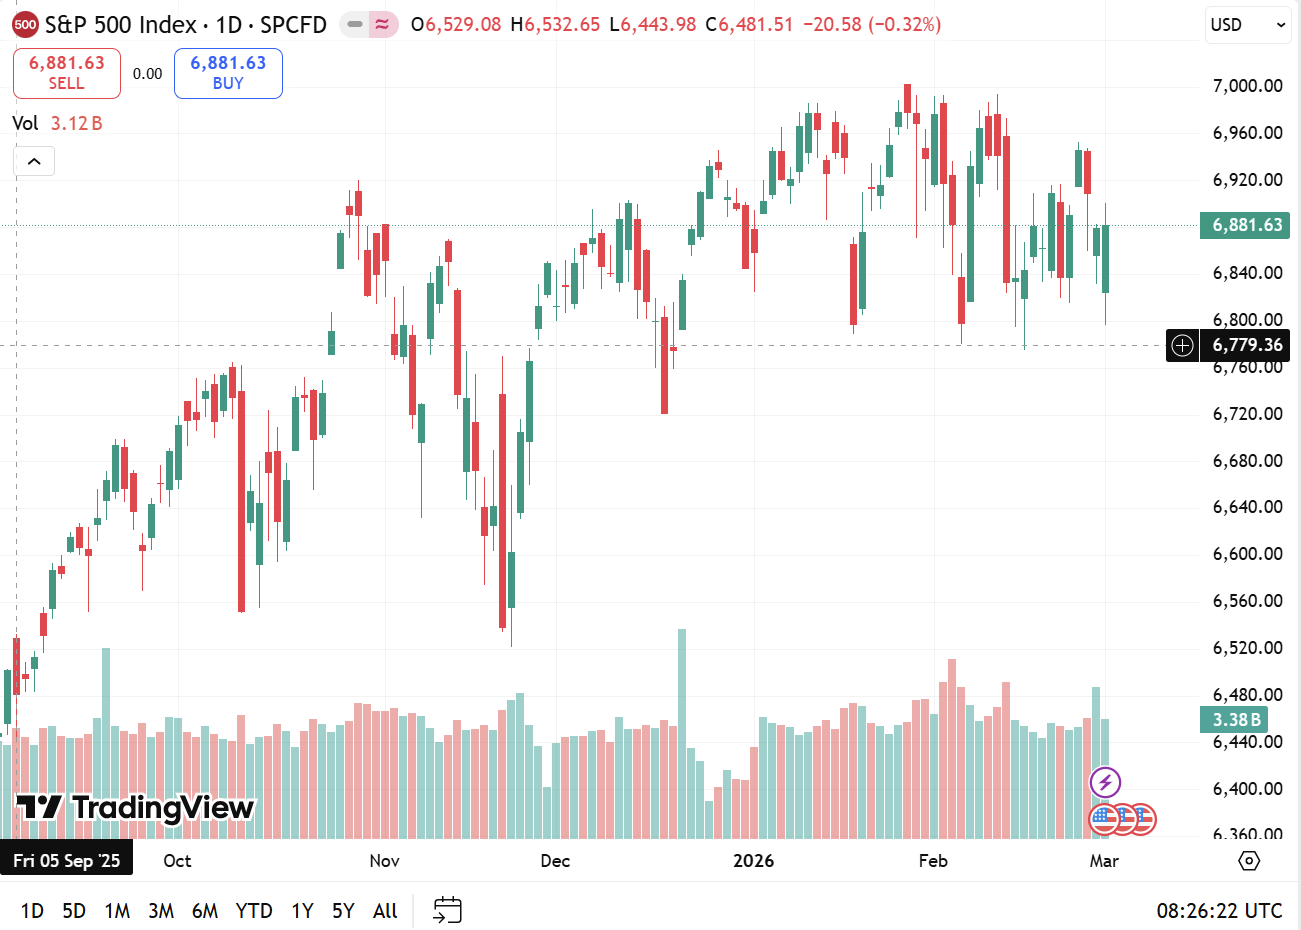
S&P 500: hoovering on a decision point
Right now, the U.S. index isn’t collapsing and that is significant.
Here’s the practical way to think about it:
- Price is hovering around a support zone that bulls defended last week.
- On a chart, this isn’t panic, this is indecision.
Instead of “stocks fall because Iran war,” traders are saying: “We acknowledge the risk, but we’re not ready to price a full-blown macro regime shift.”
That is a credibility gap. Markets respect the headline risk, but they’re still testing how serious it really is.
What to watch: If we get clean closes below support, with volatility spiking, then smart money stops absorbing dips and starts de-risking portfolios.
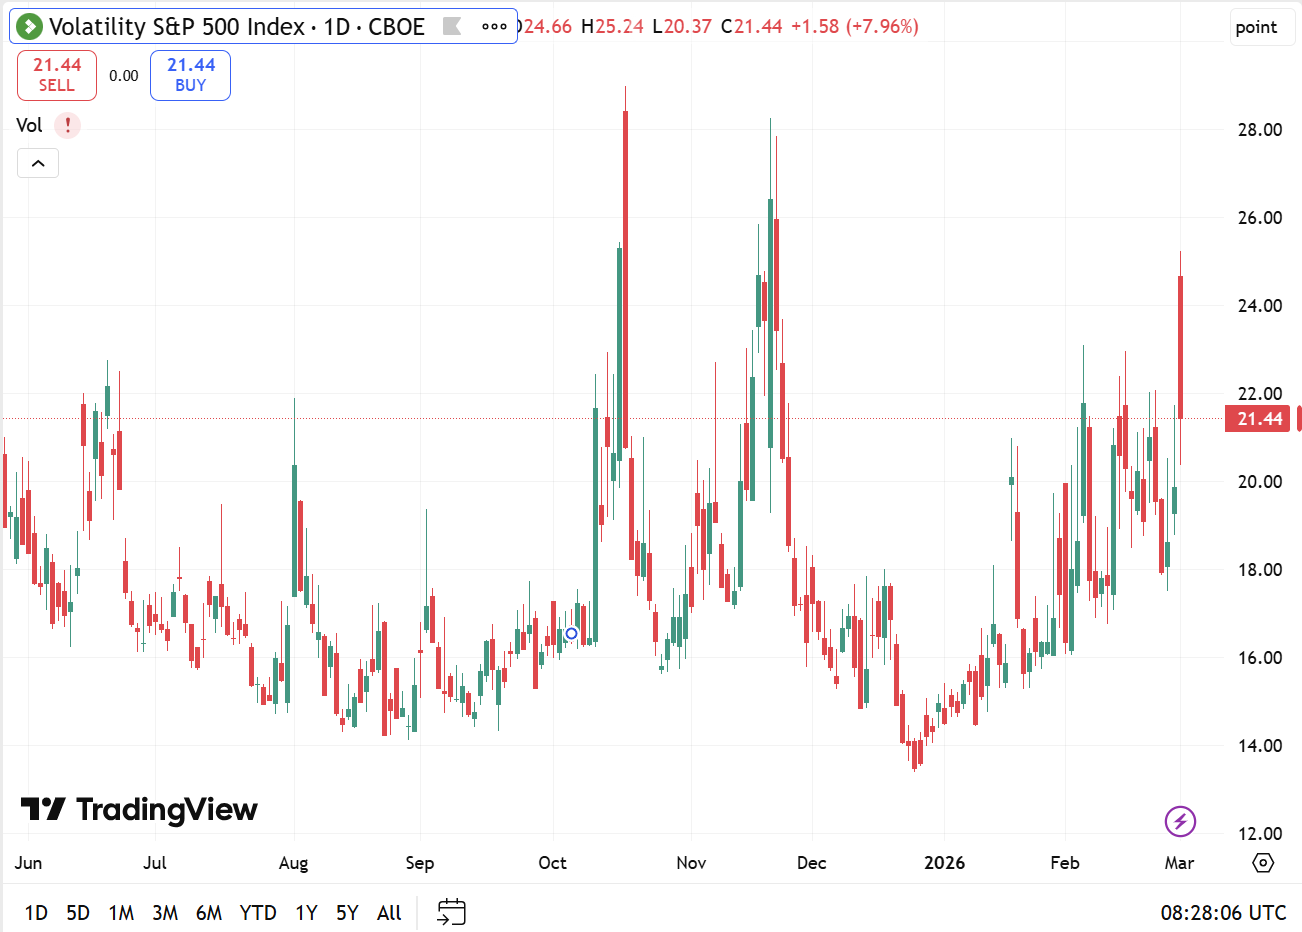
Volatility is not exploding… yet!
One of the best tells for real fear is volatility.
Right now:
- VIX is elevated compared to recent ranges, but not screaming panic.
- The market is buying some protection but not enough to signal systemic fear.
This feels like hedging demand, not capitulation. Volatility is telling us the tape is awake but not afraid.
For context, historically:
- VIX above 30 = stress regime
- VIX 20 to 25 = hedging demand
- Sub 20 = complacency
We are currently in the middle bucket.
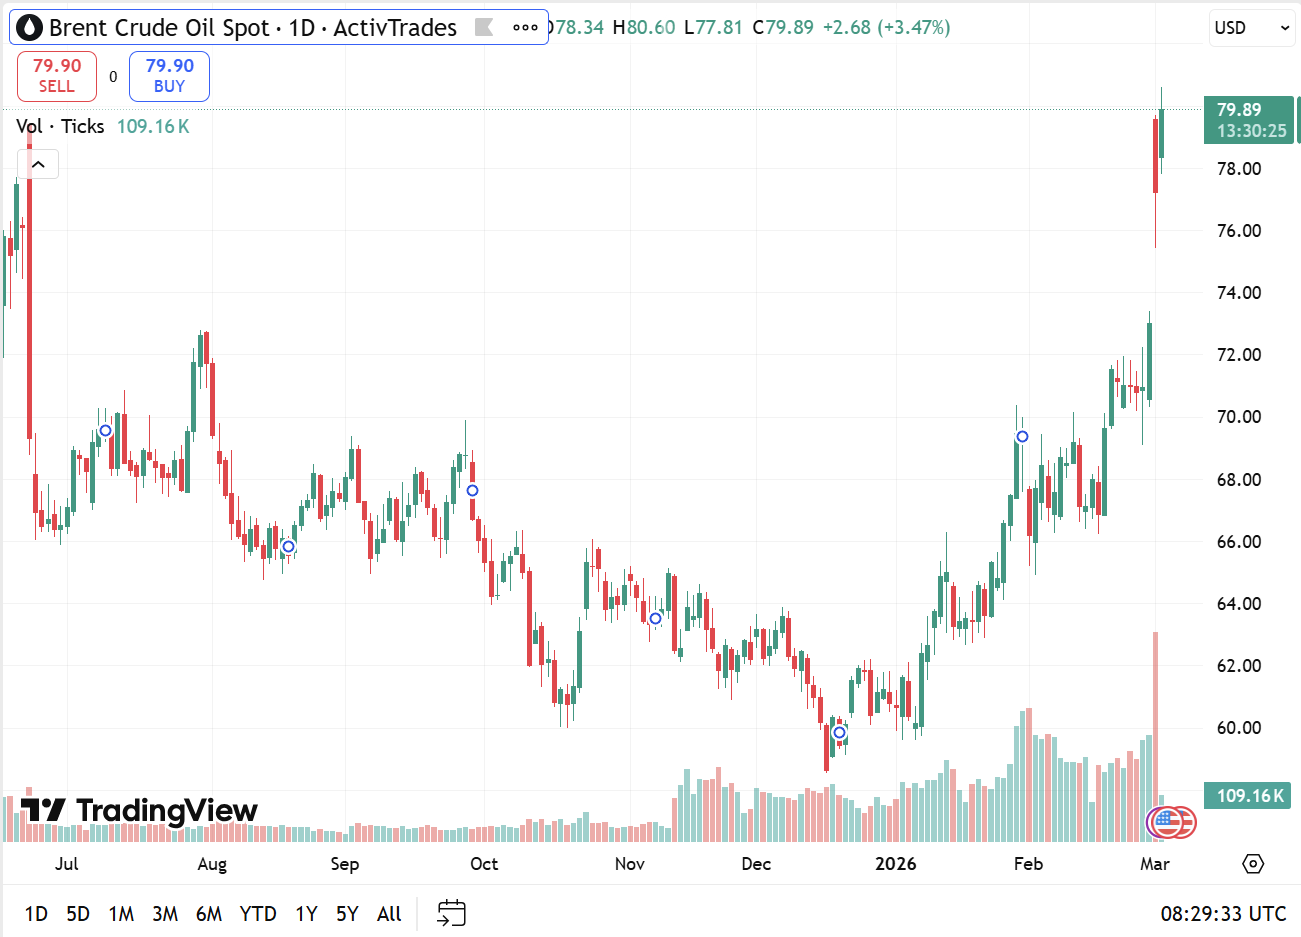
Oil and logistics: the real war indicators
Here’s where the real risk is being priced:
- Oil isn’t just about spot crude prices, it is about shipping and logistics spreads.
- If you only look at Brent crude numbers, you miss that the cost of moving oil is what truly reflects chokepoint stress.
The Strait of Hormuz handles roughly 17-20 million barrels per day of oil flows.¹
If you’re trading energy, watch the logistics premium, not just Brent flat price.
For India, importing ~85% of crude needs, this matters significantly.³ For the UK, FTSE energy majors may cushion broader index weakness.
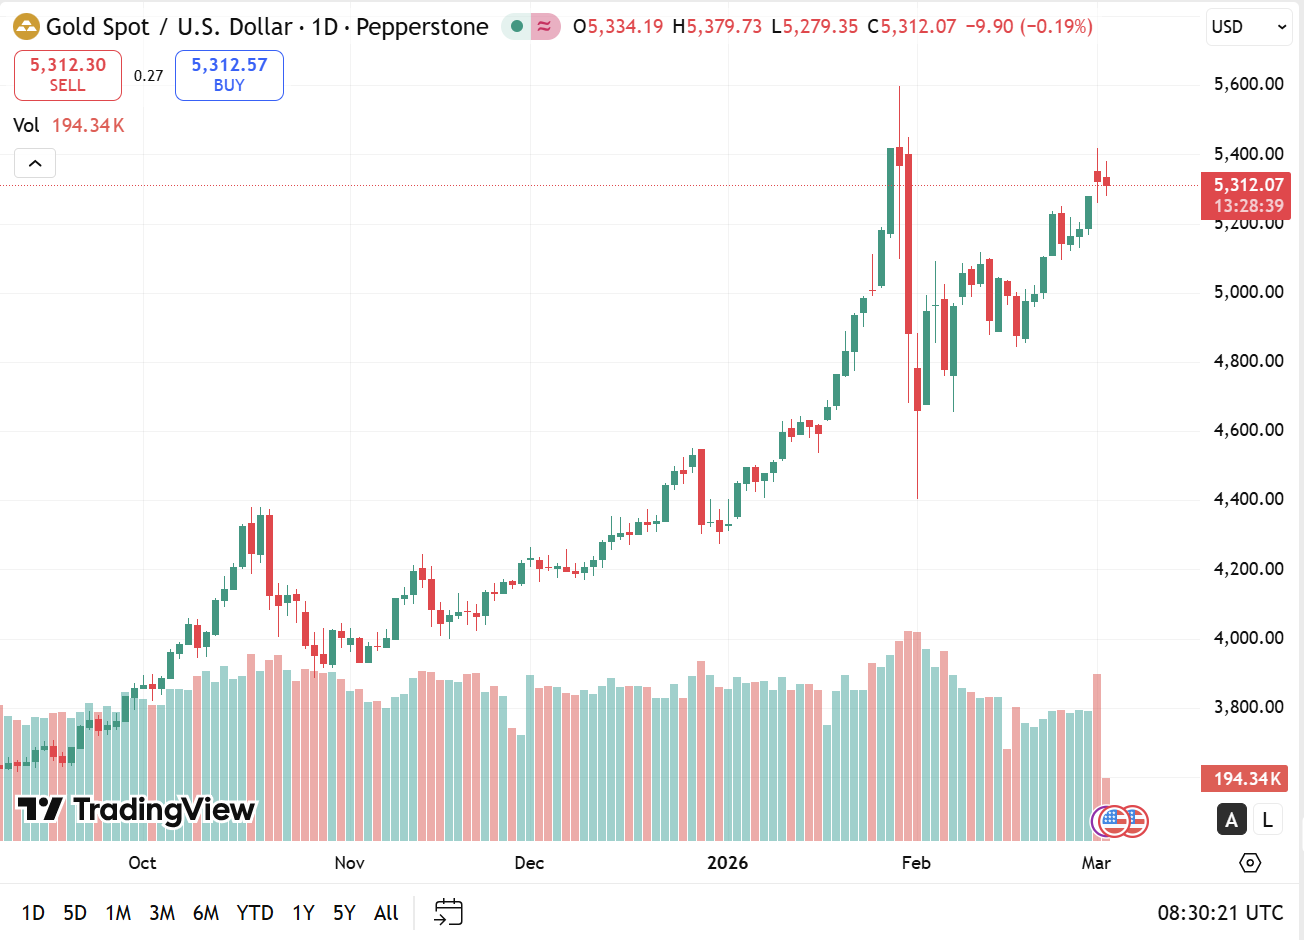
Gold: our favourite save haven
Gold isn’t behaving like a risk asset tied solely to rate expectations but it is acting like a true tail-risk hedge. When equities grind but gold stays bid, that’s a subtle signal: People aren’t overweight risk but they’re wondering how far this could go.
This is a barbell signal: equities remain tradable, but caution sits in the background.
USD Strength Matters Especially With Oil Up
Safe-haven flows into the U.S. dollar while oil rises creates macro pressure.
This combo:
- Tightens global liquidity
- Pressures emerging market currencies
- Raises imported inflation risk
For India: USD strength + oil rise historically pressures INR.
For the UK: GBP volatility and earnings translation dynamics shift.
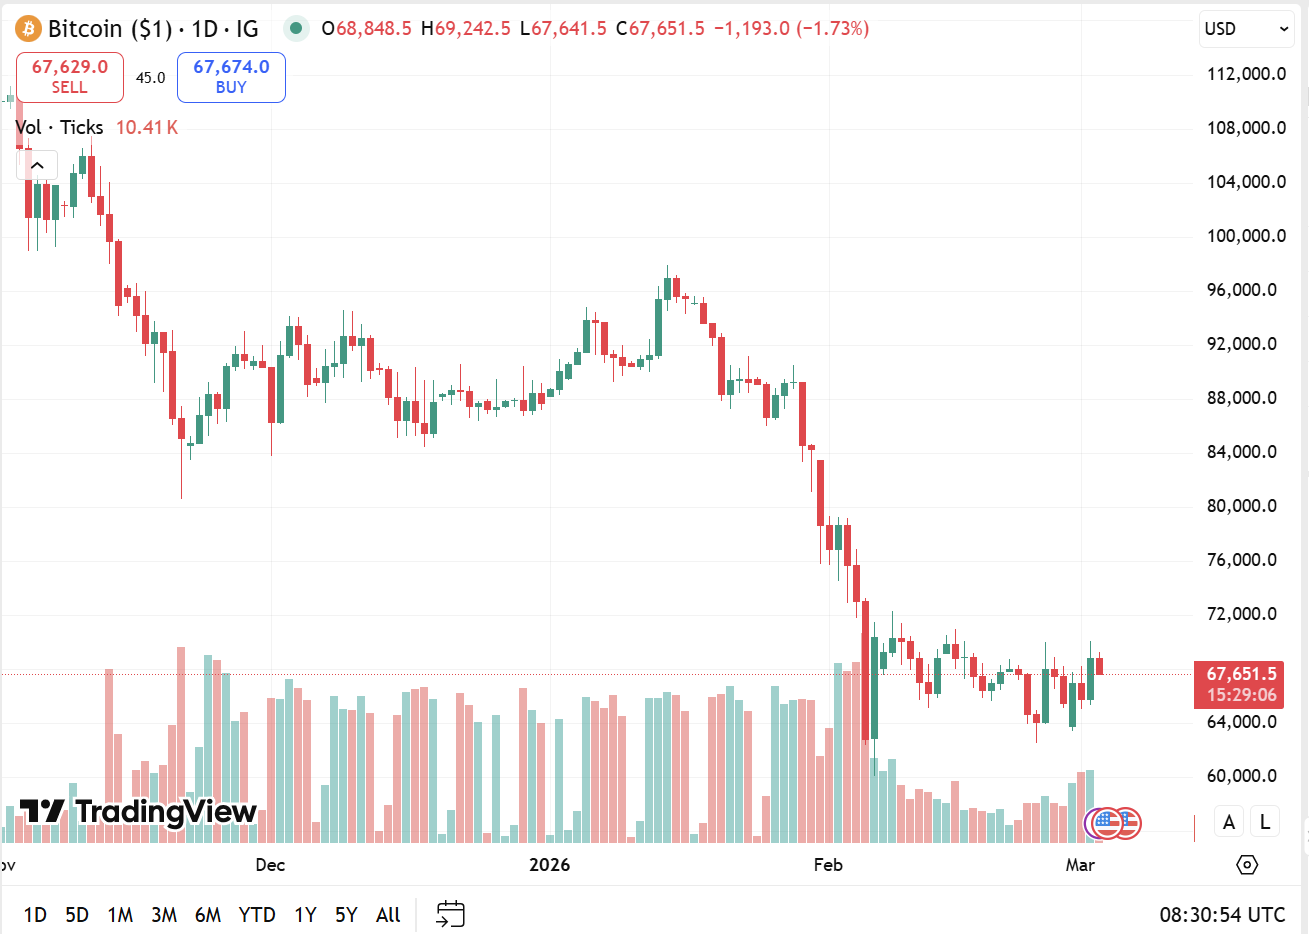
Crypto Is Behaving Like High Beta, Not Hedge
Bitcoin traders: watch this.
Despite geopolitical risk, BTC is trading like a risk proxy, wide range, no clean breakout. If BTC were acting as digital gold, we would see stronger relative upside. Instead, it is chopping, signalling risk repricing, not safe-haven demand.
Putting It All Together: What the Market Is Actually Saying
Right now:
- Headline risk is real
- Markets are pricing conditional concern, not doom
- Duration is not yet priced
The real shift happens if:
- Equities break technical structure
- Volatility sustains above stress levels
- Oil and USD rise persistently together
Until then, this is volatility, not collapse.
And as always: Price confirms narrative, not the other way around.
Sources
- U.S. Energy Information Administration (EIA): World Oil Transit Chokepoints
- Reuters: Middle East & Oil Market Coverage (March 2026)
- Government of India: Ministry of Petroleum & Natural Gas (Import Dependency Data)
- World Gold Council: Gold Performance During Geopolitical Events
- TradingView
- Bloomberg
Disclaimer: This post is for educational and informational purposes only and reflects market commentary, not investment advice. Markets are risky; you can lose money. Do your own research and consider speaking with a regulated professional before making financial decisions.
Ria Vaghela
MSc Finance graduate from the London School of Economics and Political Science (LSE)
Ria V Vaghela is an M&A Associate at RSM UK and an MSc Finance graduate from the London School of Economics and Political Science (LSE). She has worked at Jefferies, Dial Partners, GP Bullhound and 7i Capital prior to RSM UK gaining an extensive experience in finance. She has also worked as an Editor and Content Writer for The Representative Media. Apart from finance, she is interested in reading books on philosophy, self-help and economics, likes to paint and play lawn tennis.
Recommended Posts

From AI Hype to AI Proof
July 18, 2026

What Private Markets Taught Me About Long-Term Thinking
July 16, 2026
