
Gold VSA Analysis: Putting it all together

In the last two articles, Gold VSA analysis and Gold VSA analysis part 2, we analysed Gold CFD chart for our hypothesis of a potential uptrend in Gold, as an experiment to learn about the practical application of VSA as a trader and the role of RSI alongside VSA.
Progress since 14 March 2026
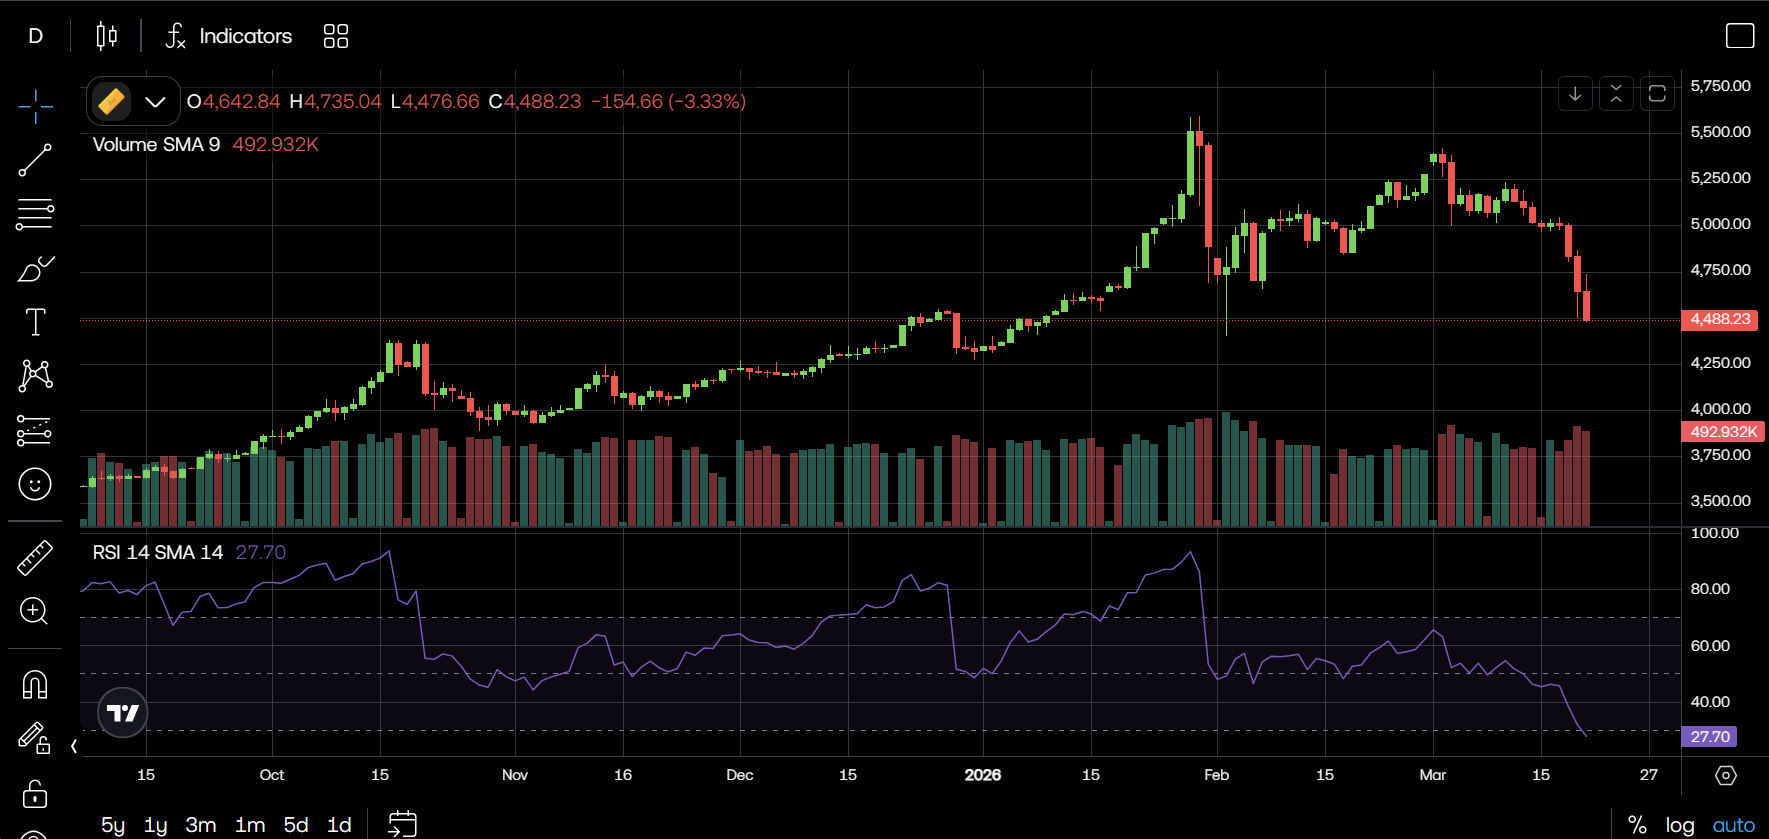
Since we last analysed the Gold CFD chart on 14 March 2026, it is clear that our hypothesis has failed the no supply test or test of supply. Based on the chart below, we can see how there was only one low spread, low volume green bar followed by three large spread, high volume red bars clearly demonstrating strength in the sell-side. RSI has also slid into the oversold area.
What next?
The key to understand from this experiment is that traders are not acting emotionally. They are constantly analysing and course correcting. In the above scenario, a trader would take note of the observation and adjust their strategy. In my understanding, a trader would look for a stronger confirmation on the potential weakening of sell-side to anticipate the start of an uptrend. As mentioned before, gold is unique as it is heavily influenced by macro factors so one cannot rely solely on charts but the mindset and methodology can be applied to any other trading or investing decision.
Key takeaway
The key takeaway from this experiment is simple. Trading or investing work best when you are disciplined, observant, unemotional and flexible. Markets do not reward rigidity, they reward flexibility and ability to constantly learn and adapt.
For those keen to learn more about trading, the concepts of VSA and RSI, refer to these articles: Trading in Futures: A Beginner’s Guide, VSA (Volume Spread Analysis) – An Introduction and Important Technical Indicators To Watch While Trading.
Disclaimer: This article and all the articles referred in this article are meant for educational purpose only and does not constitute investment advice.
Ria Vaghela
MSc Finance graduate from the London School of Economics and Political Science (LSE)
Ria V Vaghela is an M&A Associate at RSM UK and an MSc Finance graduate from the London School of Economics and Political Science (LSE). She has worked at Jefferies, Dial Partners, GP Bullhound and 7i Capital prior to RSM UK gaining an extensive experience in finance. She has also worked as an Editor and Content Writer for The Representative Media. Apart from finance, she is interested in reading books on philosophy, self-help and economics, likes to paint and play lawn tennis.
Recommended Posts

From AI Hype to AI Proof
July 18, 2026

What Private Markets Taught Me About Long-Term Thinking
July 16, 2026
