
Gold VSA analysis part 2

In our last analysis on Gold CFD here, we concluded that, according to VSA, the market may be approaching the test for supply. This test required Friday 13 March 2026’s indicator to be:
- a small spread down candle, and
- low volume.
However, on Friday, we observed:
- a wider spread down candle, and
- high volume.
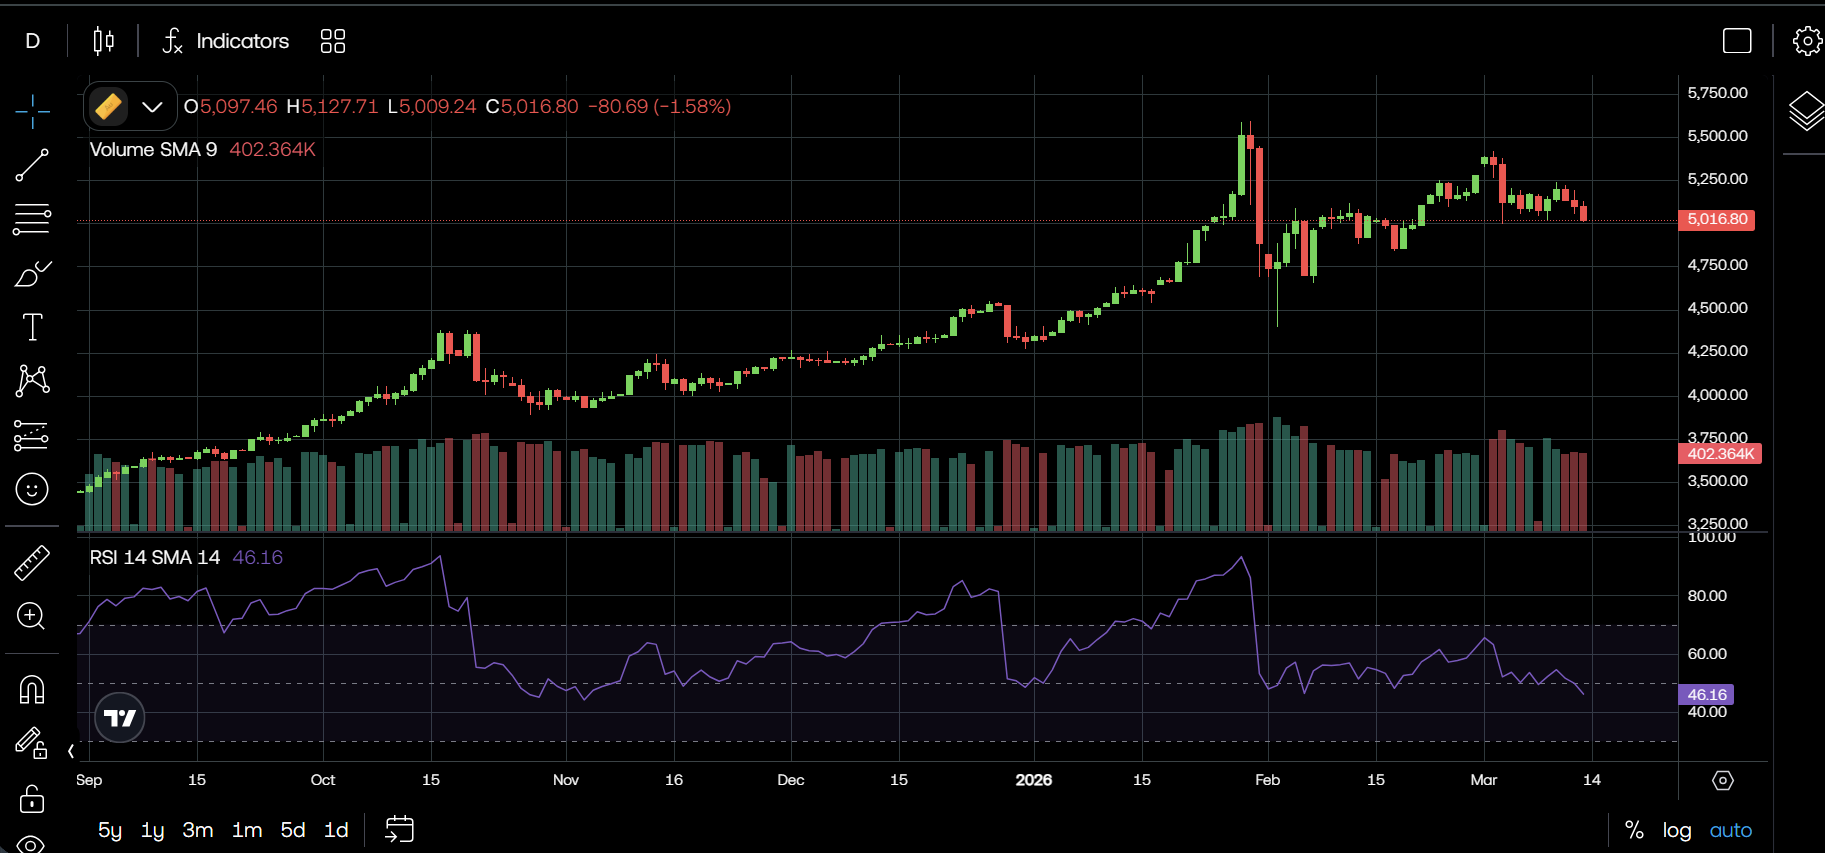
This shows that the test for no supply has failed suggesting that supply is still dominant in the gold market. From VSA perspective, this indicates the market is not yet ready for an upward trend.
This analysis is crucial. If you observe how a trader thinks, they are trying to prove a hypothesis using historical data and patterns, not trying to receive 100% certainty. Our implied hypothesis was that gold is entering an upward trend. Based on our observation above and using VSA analysis, the market has not yet proved out hypothesis correct.
A note here is that gold (or any stock, commodity or ticker) is not only influenced by historical data and patterns but also influenced by macroeconomic and geopolitical environment. On Friday, we observed a few narratives which could have potentially impacted the value and that would have been priced in that may have given out the observation above.
- On Friday, US Dollar strengthened thus expecting fewer rate cuts in the future. Usually, US Dollar price and interest rates have direct impact on Gold. The flow is such that higher interest rate means stronger US dollar and hence, pressure on gold price. Also historically it is observed that US Dollar and gold price have an inverse relationship.
- The escalating war in the Middle East and every news around it, particularly the tensions in the Straight of Hormuz which is significantly impacting energy and commodity markets, is making the markets react globally, not just gold in particular.
Going into the next trading session on Monday, Gold CFD trackers may look out for one of the following:
- A proper no supply test characterised by a small spread down candle and low volume by the end of Monday.
- Another wide spread down candle with high volume suggesting weakness.
- A sideways consolidation characterised by absorbing supply i.e. narrow spreads and consistently high volume which may gradually over a few days before breaking out into an uptrend.
This is a great example and demonstration to encourage “wait before acting” behaviour as an educated investor. Rather than jumping into a single signal or the bandwagon, many traders form the hypothesis first, wait for confirmation from the patterns, adjust their view (flexibility) and then take a position. This discipline is crucial not just for VSA adopters or trader but also for every investor. While a retail investor may not have the need to conduct an analysis of this depth, making an investment merely based on market rumours or a WhatsApp group is not wise.
These articles are structured for the purpose of education to students, budding traders as well as investors who want a rationale investing mindset.
Disclaimer: this article is for educational purpose only and does not constitute investment advice.
Ria Vaghela
MSc Finance graduate from the London School of Economics and Political Science (LSE)
Ria V Vaghela is an M&A Associate at RSM UK and an MSc Finance graduate from the London School of Economics and Political Science (LSE). She has worked at Jefferies, Dial Partners, GP Bullhound and 7i Capital prior to RSM UK gaining an extensive experience in finance. She has also worked as an Editor and Content Writer for The Representative Media. Apart from finance, she is interested in reading books on philosophy, self-help and economics, likes to paint and play lawn tennis.
Recommended Posts

Scam 2026!
June 7, 2026

The distinctive tale of the UK economy in May 2026
May 19, 2026

Understanding politics from a financial lens
May 12, 2026